Guide to Analytical Model Calculations in the Batoi Insight
Normalizing Values in Batoi Insight
Normalization is a crucial process in data analysis. It allows us to compare variables from different intervals on a common scale. Batoi Insight supports normalizing values into three intervals: [0, 1], [0, 100], and a custom interval [𝑐, 𝑑]
Normalizing to [0, 1] Interval
To normalize a value 𝑥 from an interval [𝑎, 𝑏] to the interval [0, 1], we can use the following formula:

Example Calculation:
Let's say 𝑥 is a value in the interval [1, 5] with 𝑥 = 3.

For interval [15, 50] with 𝑥 = 25:

Normalizing to [0, 100] Interval
To normalize a value 𝑥 from an interval [𝑎, 𝑏] to the interval [0, 100], we can use the following formula:

Example Calculation:
For interval 1 − 5:

For interval 15 − 50:

Normalizing to a Default Interval [𝑐, 𝑑]
To normalize a value 𝑥 from an interval [𝑎, 𝑏] to a new interval [𝑐, 𝑑], we can use the following formula:

Example Calculation:
Let's assume the default interval is [10, 20].
For interval 1 − 5:

For interval 15 − 50:

Calculating Weighted Scores and Statistical Tendency
Weighted scores and statistical tendencies are critical for analyzing survey data accurately. Batoi Insight uses these metrics to provide a comprehensive view of survey responses.
Weighted Scores
Each question 𝑞i in a questionnaire has an associated weight wi and a score value si:
WSi = wi . si,
where WSi is the weighted score value for the i-th question. This calculation helps understand each question's relative importance based on its assigned weight.
Statistical Tendency
Statistical tendencies summarize data points and include mean, median, and mode measures. These measures help in understanding the central point around which data values cluster.
For score values:
ST(si) = Statistical Central Tendency of score values for the ith question
For weighted score values:
ST(wisi) = Statistical Central Tendency of weighted score values for the ith question
Group Scores
Group scores aggregate individual responses to provide a higher-level view of data.
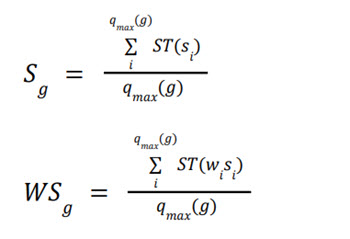
For a group g, the score Sg and weighted score WSg are calculated as:

Where qmax(g) is the maximum number of questions accounted for the score in group g.
Adjustment Coefficient
Adjustment coefficients fine-tune the analysis by accounting for specific group characteristics and ensuring accurate data representation.
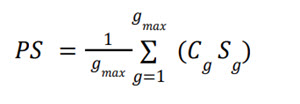
The final score with adjustment coefficient Cg for group g is:

Handling Multiple Score Parameters
If a group has multiple score parameters associated with it, the intra-group statistical operation is defined as:

Where W() is the score weight and [𝑂𝑝𝑒𝑟𝑎𝑡𝑖𝑜𝑛] can be +, -, ⋅, /.
Attributes of an Analytical Model
An analytical model in Batoi Insight includes the following attributes:
- Name: The identifier for the model.
- Description (Optional): A brief explanation of the model.
- Normalization: Specifies whether normalization is None, Unity, or Percentage.
- Statistical Tendency: Determines the central tendency measure used (Mode, Mean, Median)
Note: Statistical central tendencies describe the center of a data set or distribution. They summarize the dataset by identifying the central point around which the data values cluster.
Practical Application of Calculations
Let's apply these concepts to a practical example. Suppose we have a questionnaire with the following details:
- The interval for responses: 1 − 5 for one set, 15 − 50 for another.
- Weights assigned to questions.
- Multiple score parameters for specific groups.
We want to normalize the responses, calculate weighted scores, and apply an adjustment coefficient to derive the final score for a group.
1. Normalize the Responses:
For a response 𝑥 = 4 in the interval 1 − 5:

For a response 𝑥 = 30 in the interval 15 − 50:

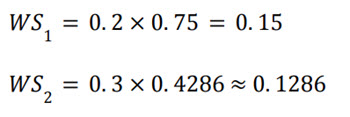
2. Calculate Weighted Scores:
Assume the weights are w1 = 0.2 and w2 = 0.3 for two questions with normalized scores s1 = 0.75 and s2 = 0.4286

3. Compute Group Scores and Apply Adjustment Coefficient:
Let's assume the adjustment coefficient Cg = 1.1 and the group has two questions:

Applying the adjustment coefficient:

Conclusion
Batoi Insight's robust calculation and normalization features empower users to analyze detailed and accurate survey data. By understanding and utilizing these tools, users can derive valuable insights and make informed decisions based on comprehensive data analysis.
Please refer to our documentation or contact support for further assistance or detailed examples.


